View a detailed examination of the Route Analysis tabs, including the Overview and Variants tabs, which display various metrics and route variations for analyzed Origin & Destination pairs.
Once you have selected the Route or Road Segment you wish to look into for your Route Analysis results, toggle between the Overview and Variants tab to look further into the data.
Overview
The Overview tab displays several metrics from your analysis: Journey Count, Vehicle Class Breakdown, Origins, Destinations, Connectors, Vocation Breakdown, and Industry Breakdown.
| Metric | Description |
|---|
| Journey Count | The number of journeys between the O/D pair that met the criteria of your analysis. |
| Route Analysis | The routes selected for an analysis between Origin and Destination. Click to view the Route Analysis queue. |
| Expansion Factors | The general expansion factor at a state level. Reference Locations are provided where available for closer estimates at a local level. |
| Origins, Connectors, and Destinations | The number of Origins, Connectors, and Destinations, respectively, that were included in the O/D analysis. |
| Vehicle Class | A pie chart that represents the percentage of journeys in your analysis that were performed by each vehicle class. |
| Vocation Breakdown | A pie chart that represents the percentage of journeys in your analysis that had each vocation. |
| Industry Breakdown | A pie chart that represents the percentage of journeys by industry as defined by the primary NAICS code. The primary NAICS code is determined by the fleet operating the vehicle that is contributing to the data. |
Variants
For each Origin and Destination (O/D) pair analyzed through Route Analysis, there may be one or many routes returned, depending on the O/D pair and the input, Route Grouping Threshold. The Route Grouping Threshold refers to the percentage of two routes that needs to be the same for them to be grouped together as a single route; this is done for the similar routes to be counted as a single representative route. To account for the possibility of multiple flows being counted as a single route, variant attributes are used to capture the variations on the main route for all included routes. The most common variant forms the basis of the main route returned, and all the other variants are returned as an array against the main route.
For example: An O/D pair analysis is executed with an 80% route grouping threshold. The O/D pair has three journeys with each covering 90% the same route, except for a small stretch of road where two journeys take one deviation, and the third journey takes another. The first deviation will be called Route 1, and the second deviation will be called Route 2. The main route will be the traffic flow from the edge of the Origin zone to the edge of the Destination, followed by the majority of journeys (Route 1). The stretch where there is variability from the remaining journey(s) (Route 2) is captured as a variant of Route 1.
If a user would not like any grouping (setting a route grouping threshold of 1.0), there will still be grouping done to complete any necessary gap filling. If a user does want to group similar trips, their route grouping threshold will only be used if it is lower than the gap filling threshold to ensure accurate gap filling. Once grouped, we will try to fill in any gaps with paths that exist from another route in the group.
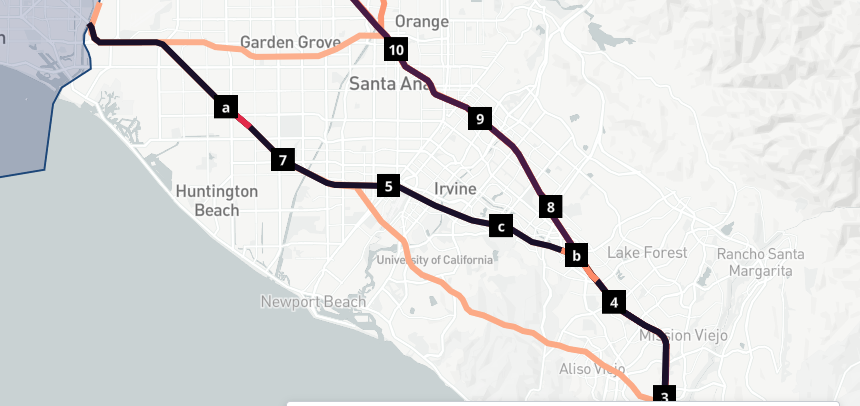
The Variants tab displays the most variants of the route you are investigating, as well as their journey counts. While routes are labeled on the map numerically, variants are labeled alphabetically. Hover over a variant to display quick metrics or click to view details.